Built for analysts and researchers · macOS download coming soon
THE WORK IS VISIBLE
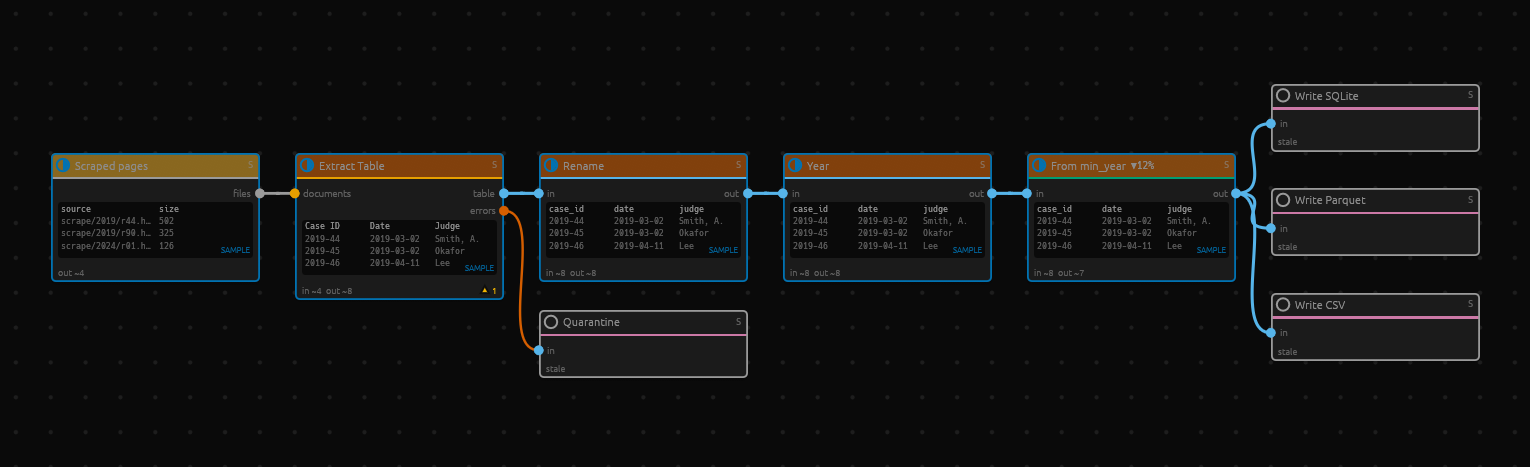
Every connection is a step you can inspect.
IOPIPE CANVAS · ROW PREVIEWScourt_rulings.iopipe
SAVE THE METHOD, NOT JUST THE OUTPUT
A clean dataset is useful. A repeatable path to it is better.
When the next survey wave lands or another batch of files arrives, the work shouldn’t start over. In ioPipe, your preparation, analysis, and exports stay connected in a saved pipeline.
HOW IT WORKS
Build it. Check it. Run it again.
Work visually, with the detail close at hand.
01 Connect the steps
Bring in your files, then connect nodes to clean, join, and analyze them. Branch the same data into a table, a chart, or several export formats.
02 See what changed
Inspect sample rows at each step before running the full dataset. Route extraction errors into a separate output so they’re available for review.
03 Keep what works
Save the whole graph as an .iopipe file. Reuse it with new inputs, share the method, or run it from the command line.
ONE CONNECTED WORKFLOW
From “what’s in these files?” to “here’s what we found.”
Keep the route from source to result in view.
↳ Make messy data usable
Extract HTML tables, clean text, handle missing values, and join datasets. Read survey formats including SPSS, SAS, and Stata.
↗ Follow through to the answer
Score survey scales, compare groups, and fit regression models. Turn the results into charts or maps in the same graph.
✳ Give AI a defined job
Classify reviews or extract fields with a configured local or hosted model. Cache responses and replay them as you refine downstream steps.
⇄ Take the work with you
Export datasets to CSV, Parquet, SQLite, and more. Save charts as SVG, PNG, or PDF. Share the pipeline alongside the result.
Work with an AI assistant, too. Through MCP, a compatible assistant can inspect your pipeline, connect nodes, preview results, and start runs.
REAL WORKFLOWS, CONCRETE OUTPUTS
Start with a question. End with something useful.
01 / DATA EXTRACTION
Turn court pages into a dataset
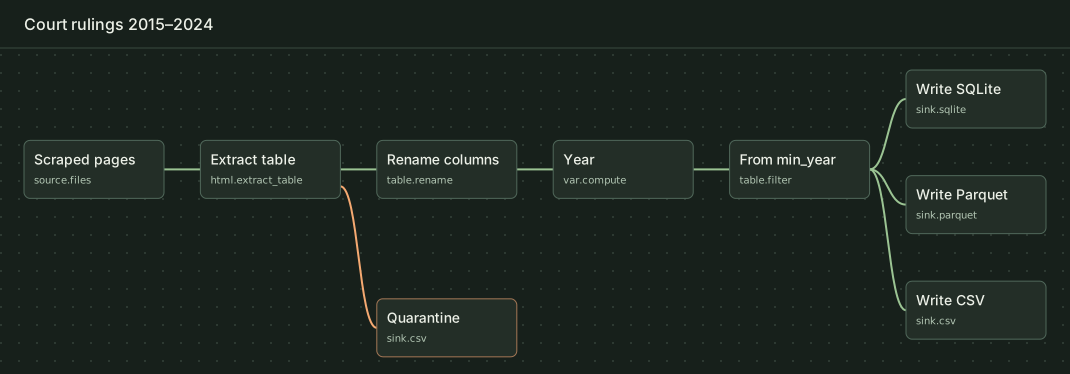
Read scraped HTML, extract ruling tables, rename the columns, and filter by year. The same cleaned data goes to CSV, Parquet, and SQLite. Pages without a matching table go to a quarantine file.
The sample run exported seven rulings and flagged one page with no matching table.
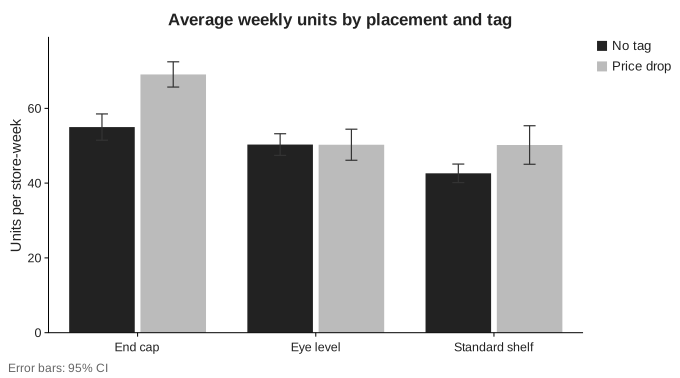
Aggregate weekly iced tea sales to the store level. Then use a two-way ANOVA to test whether the tag’s effect depends on shelf placement, and chart the six group means.
In the simulated data, end-cap displays averaged 69 units per week with a tag and 55 without. Eye-level displays averaged about 50 either way.
Interaction chart exported by ioPipe
03 / GEOSPATIAL ANALYSIS
Map where the 2024 polls missed
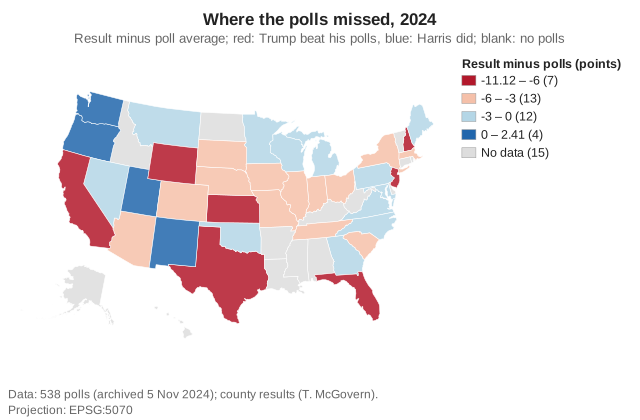
Aggregate archived 538 polls and county election returns to the state level. Join the results to Census state boundaries and map the gap between the final poll average and the result.
All ten states with at least ten late polls shifted toward Trump relative to their poll averages in this run.
Polling error map exported by ioPipeMore example projects
Brand tracking — combine survey waves, score scales, and export a codebook and SPSS file.
Satisfaction drivers — use factor analysis and regression to study satisfaction and score churn risk.
Campaign test — validate a send log, join CRM records, and compare email offers by segment.
App redesign — test how an app redesign affects spending and whether the indirect effects vary by age.
Customer reviews — extract review fields from HTML and compare human and model topic labels. AI steps require a configured model.
Product reviews — classify real reviews by sentiment using a local model adapter. This example requires local model setup.
Store catchment — find the nearest store, group customers by distance, and map areas with weak coverage.
UNDER THE HOOD
Simple to follow. Plenty to work with.
Explore the built-in tools for preparation, analysis, visualization, and export.
Explore the full node catalog and Python options
Built-in node catalog
Expand a category to see its nodes. Each entry shows the name from the app and the identifier used in .iopipe files. Run iopipe nodes <node-id> to see a node’s ports and parameters.
File discovery and input readers 5
Files source.files
Read CSV source.csv
Read SAS source.sas
Read SPSS source.sav
Read Stata source.dta
HTML parsing and extraction 3
Extract Fields html.extract_fields
Extract Table html.extract_table
Parse HTML html.parse
Column transformations 18
Automatic Recode var.autorecode
Clean Text var.clean_text
Compute Variable var.compute
Count Values within Cases var.count
Date & Time var.datetime
Dummy Coding var.dummy
Lag var.lag
Lookup / Map Values var.lookup
Pseudonymise var.pseudonymise
Recode var.recode
Rename table.rename
Replace Missing Values var.replace_missing
Reverse Score var.reverse
Scale Score var.scale_score
Select / Drop / Reorder table.select
Standardize var.standardize
String Functions var.strings
Visual Binning var.binning
Row operations 7
Add Row Number table.row_number
Explode table.explode
Identify Duplicate Cases table.duplicates
Limit / Range table.limit
Sample table.sample
Select Cases table.filter
Sort Cases table.sort
Joins, aggregation, and reshaping 7
Aggregate table.aggregate
Join table.join
Merge: Add Cases merge.add_cases
Merge: Add Variables merge.add_variables
Restructure: Cases to Variables restructure.cases_to_vars
Restructure: Variables to Cases restructure.vars_to_cases
SQL table.sql
Labels, weights, and validation 7
Apply Labels meta.apply_labels
Define Missing Values meta.missing
Split File meta.split
Validate Data meta.validate
Value Labels meta.value_labels
Variable Properties meta.properties
Weight Cases meta.weight
Data profiling and summaries 7
Crosstabs stats.crosstabs
Data Profile stats.profile
Descriptives stats.descriptives
Explore / Quantiles stats.explore
Frequencies stats.frequencies
Means by Group stats.means
Missing Value Patterns stats.missing_patterns
File, database, and report outputs 10
Codebook sink.codebook
Export Chart sink.chart
Results Table sink.results_table
Save Model sink.model
Write CSV sink.csv
Write JSONL sink.jsonl
Write Parquet sink.parquet
Write SPSS sink.sav
Write SQLite sink.sqlite
Write Stata sink.dta
Statistical tests and models 12
ANOVA stats.anova
Chi-square stats.chisquare
Correlation Matrix stats.correlation
Linear Regression stats.linear
Logistic Regression stats.logistic
Mediation & Moderation (PROCESS) stats.mediation
Multiple Comparisons stats.p_adjust
Nonparametric Tests stats.nonparametric
PCA / Factor Analysis stats.factor
Predict stats.predict
Reliability stats.reliability
t-tests stats.ttest
Charts and result tables 12
Bar Chart chart.bar
Box Plot chart.box
Chart Style chart.style
Coefficient Plot chart.coefficients
Heatmap chart.heatmap
Histogram chart.histogram
Line / Time Series chart.line
Map chart.map
Model Diagnostics chart.diagnostics
Q-Q Plot chart.qq
Scatter chart.scatter
Small Multiples chart.grid
Geospatial processing and maps 34
Aggregate & Suppress geo.aggregate_suppress
Aggregate to Areas geo.aggregate_areas
Areal Interpolation geo.areal_interpolation
Buffer geo.buffer
Clip geo.clip
Dissolve geo.dissolve
Distance geo.distance
Explode Multi-part geo.explode
Gazetteer Match geo.gazetteer_match
Geocode geo.geocode
Geomask geo.geomask
Geometry to Columns geo.geometry_to_columns
Grid / Tessellate geo.grid
H3 Index geo.h3
Make Points geo.make_points
Measure geo.measure
Moran's I geo.morans_i
Nearest Neighbour geo.nearest
Parse Geometry geo.parse_geometry
Read GeoJSON geo.read_geojson
Read GeoPackage geo.read_geopackage
Read GeoParquet geo.read_geoparquet
Read Shapefile geo.read_shapefile
Reproject geo.reproject
Simplify geo.simplify
Spatial Filter geo.spatial_filter
Spatial Join geo.spatial_join
Spatial Lag geo.spatial_lag
Spatial Weights geo.spatial_weights
Validate & Repair Geometry geo.validate
Write GeoJSON geo.write_geojson
Write GeoPackage geo.write_geopackage
Write GeoParquet geo.write_geoparquet
Write Shapefile geo.write_shapefile
AI models and coding agreement 5
Agreement stats.agreement
Embed llm.embed
LLM Classify llm.classify
LLM Extract llm.extract
LLM Prompt llm.prompt
Reusable graph inputs and outputs 2
Library Input graph.input
Library Output graph.output
Optional Python sidecar
Use Python reference implementations for Descriptives, Means, Frequencies, and Crosstabs during full runs. Enable it in the desktop app under Settings → Python sidecar and turn it on from the toolbar, or point the command line at your configured sidecar with iopipe run FILE.iopipe --sidecar verify.
Previews use the built-in implementation. During a full run, ioPipe falls back to the built-in node when the Python implementation declines a configuration. The node’s run statistics show which implementation ran.
BUILD ON YOUR OWN WORK
Make the next run the easy part.
ioPipe for macOS is on its way. Explore a sample workflow while the public download is being prepared.